I really enjoy
generative art.
That is, art at the intersection of computers and randomness.
Importantly, a set of rules or instructions governs the creation of a specific instance of generative art.
In a sense these rules are just as much the artwork as any particular result of applying the rules.
The post
What Is Generative Art?
provides a nice breakdown.
I like dabbling with generative art using either
p5.js
for JavaScript or Pillow and Matplotlib for Python.
Here are a few of my creations I'm proud of.
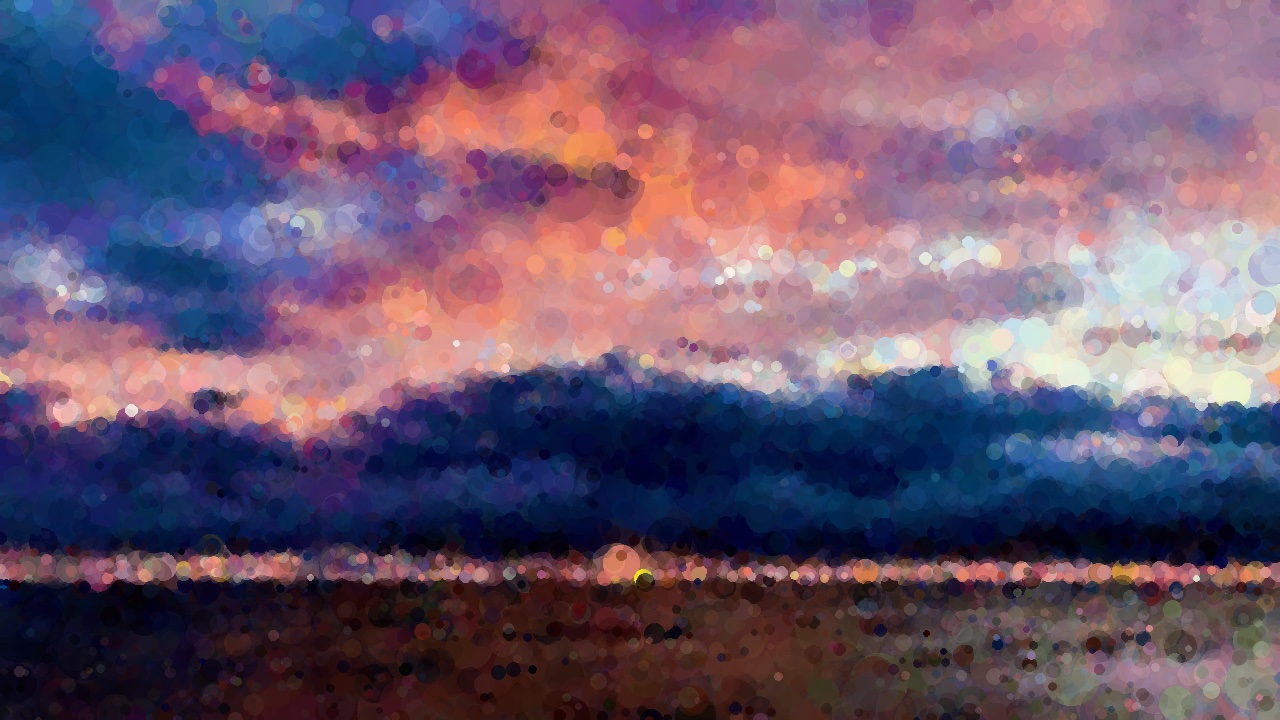
I generated these images using a
hill climbing algorithm in Python.
This algo attempts to replicate a target image by randomly drawing thousands of simple shapes, such as circles.
After drawing each shape, the algo checks whether things look more or less similar to the image it's trying to replicate.
If a shape makes things more similar the algo keeps it, otherwise the algo tries again with a different shape.
This creates a random, layered pattern that progressively begins to resemble the target image.
The algo isn't very efficient.
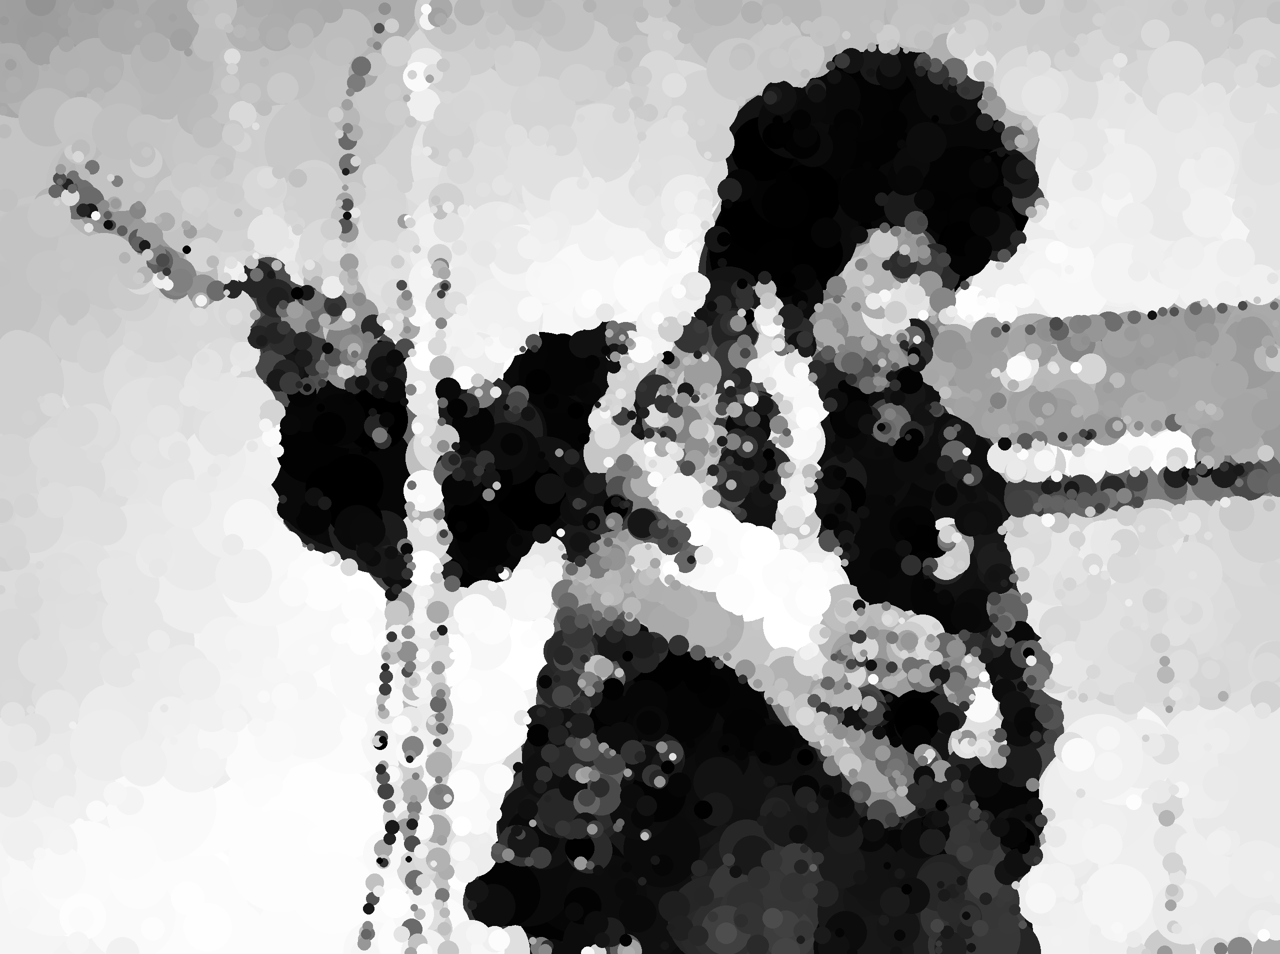
In the image of Jimi Hendrix below the algo tried drawing 100,000 random circles but ultimately used just less than 4,000 for the final image.
I wrote
a post with more details on the process.
Jimi on the guitar, with circles
(Original)
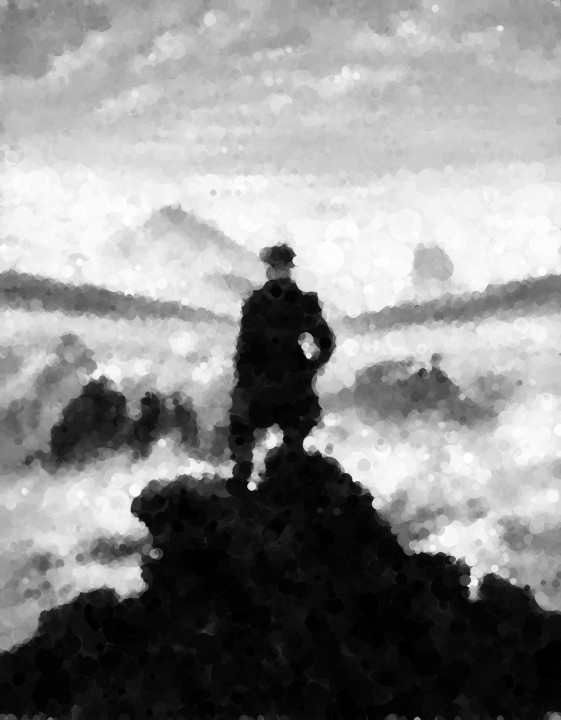
Wanderer above the Sea of Fog, with transparent circles
(Original)
Europe a Prophecy copy K plate 01, with triangles
(Original)
Sunrise behind storm clouds on Lake Michigan
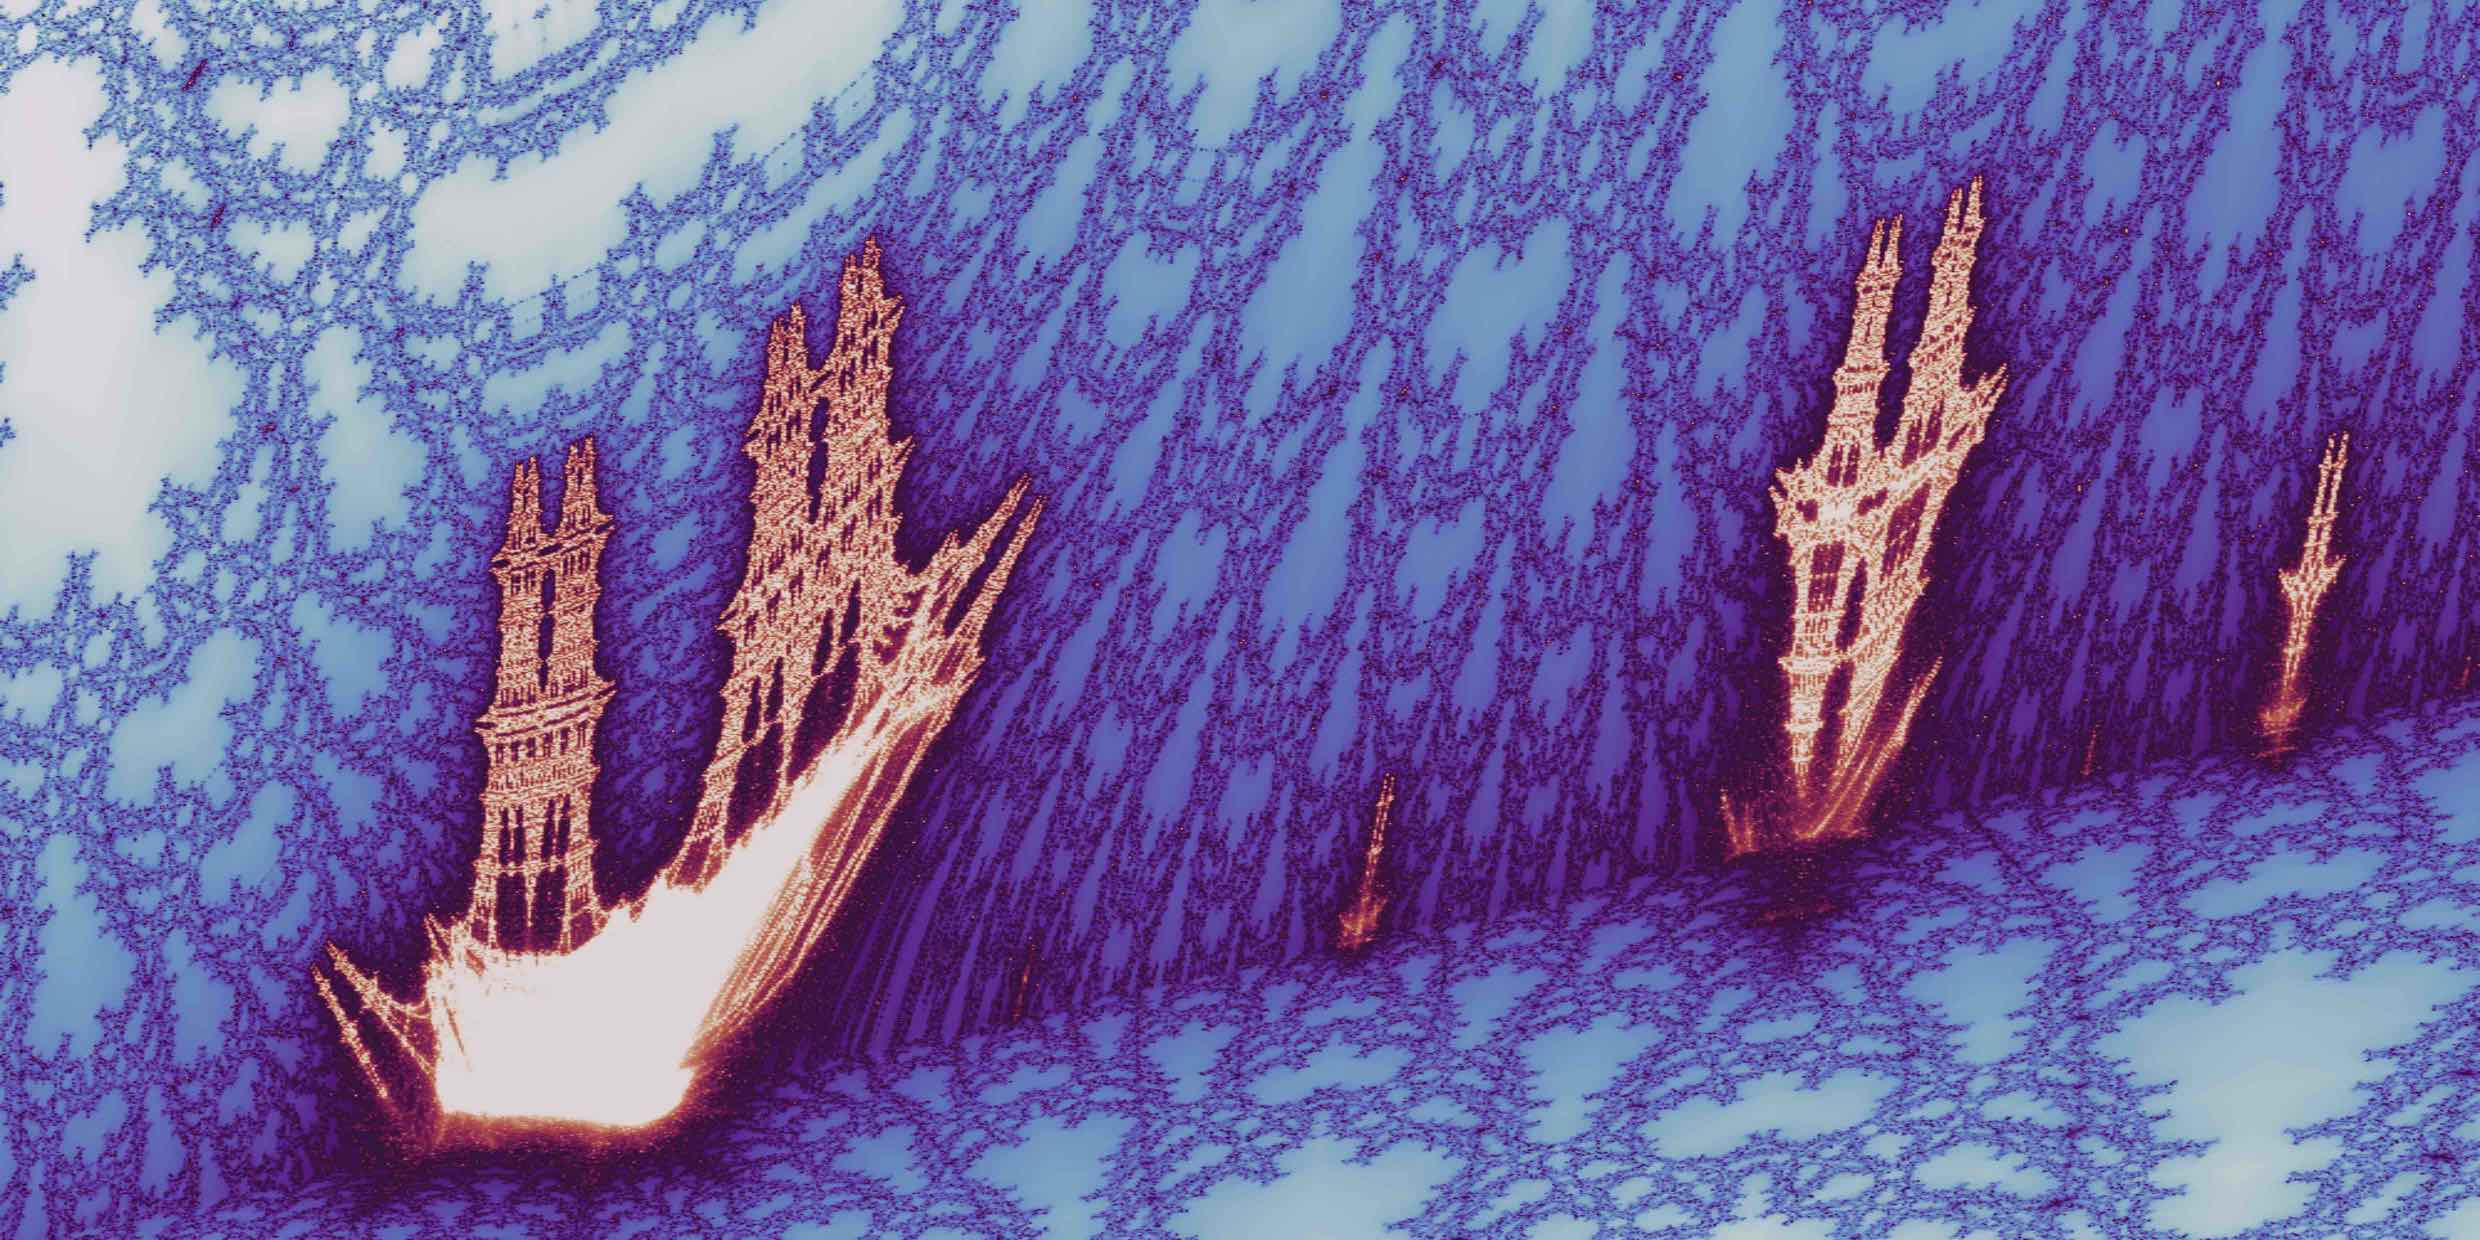
Burning Ship fractal.
The bounding box coordinates are ((0.8073, -1.40644), (0.8081, -1.40684)) and I flip the image vertically.
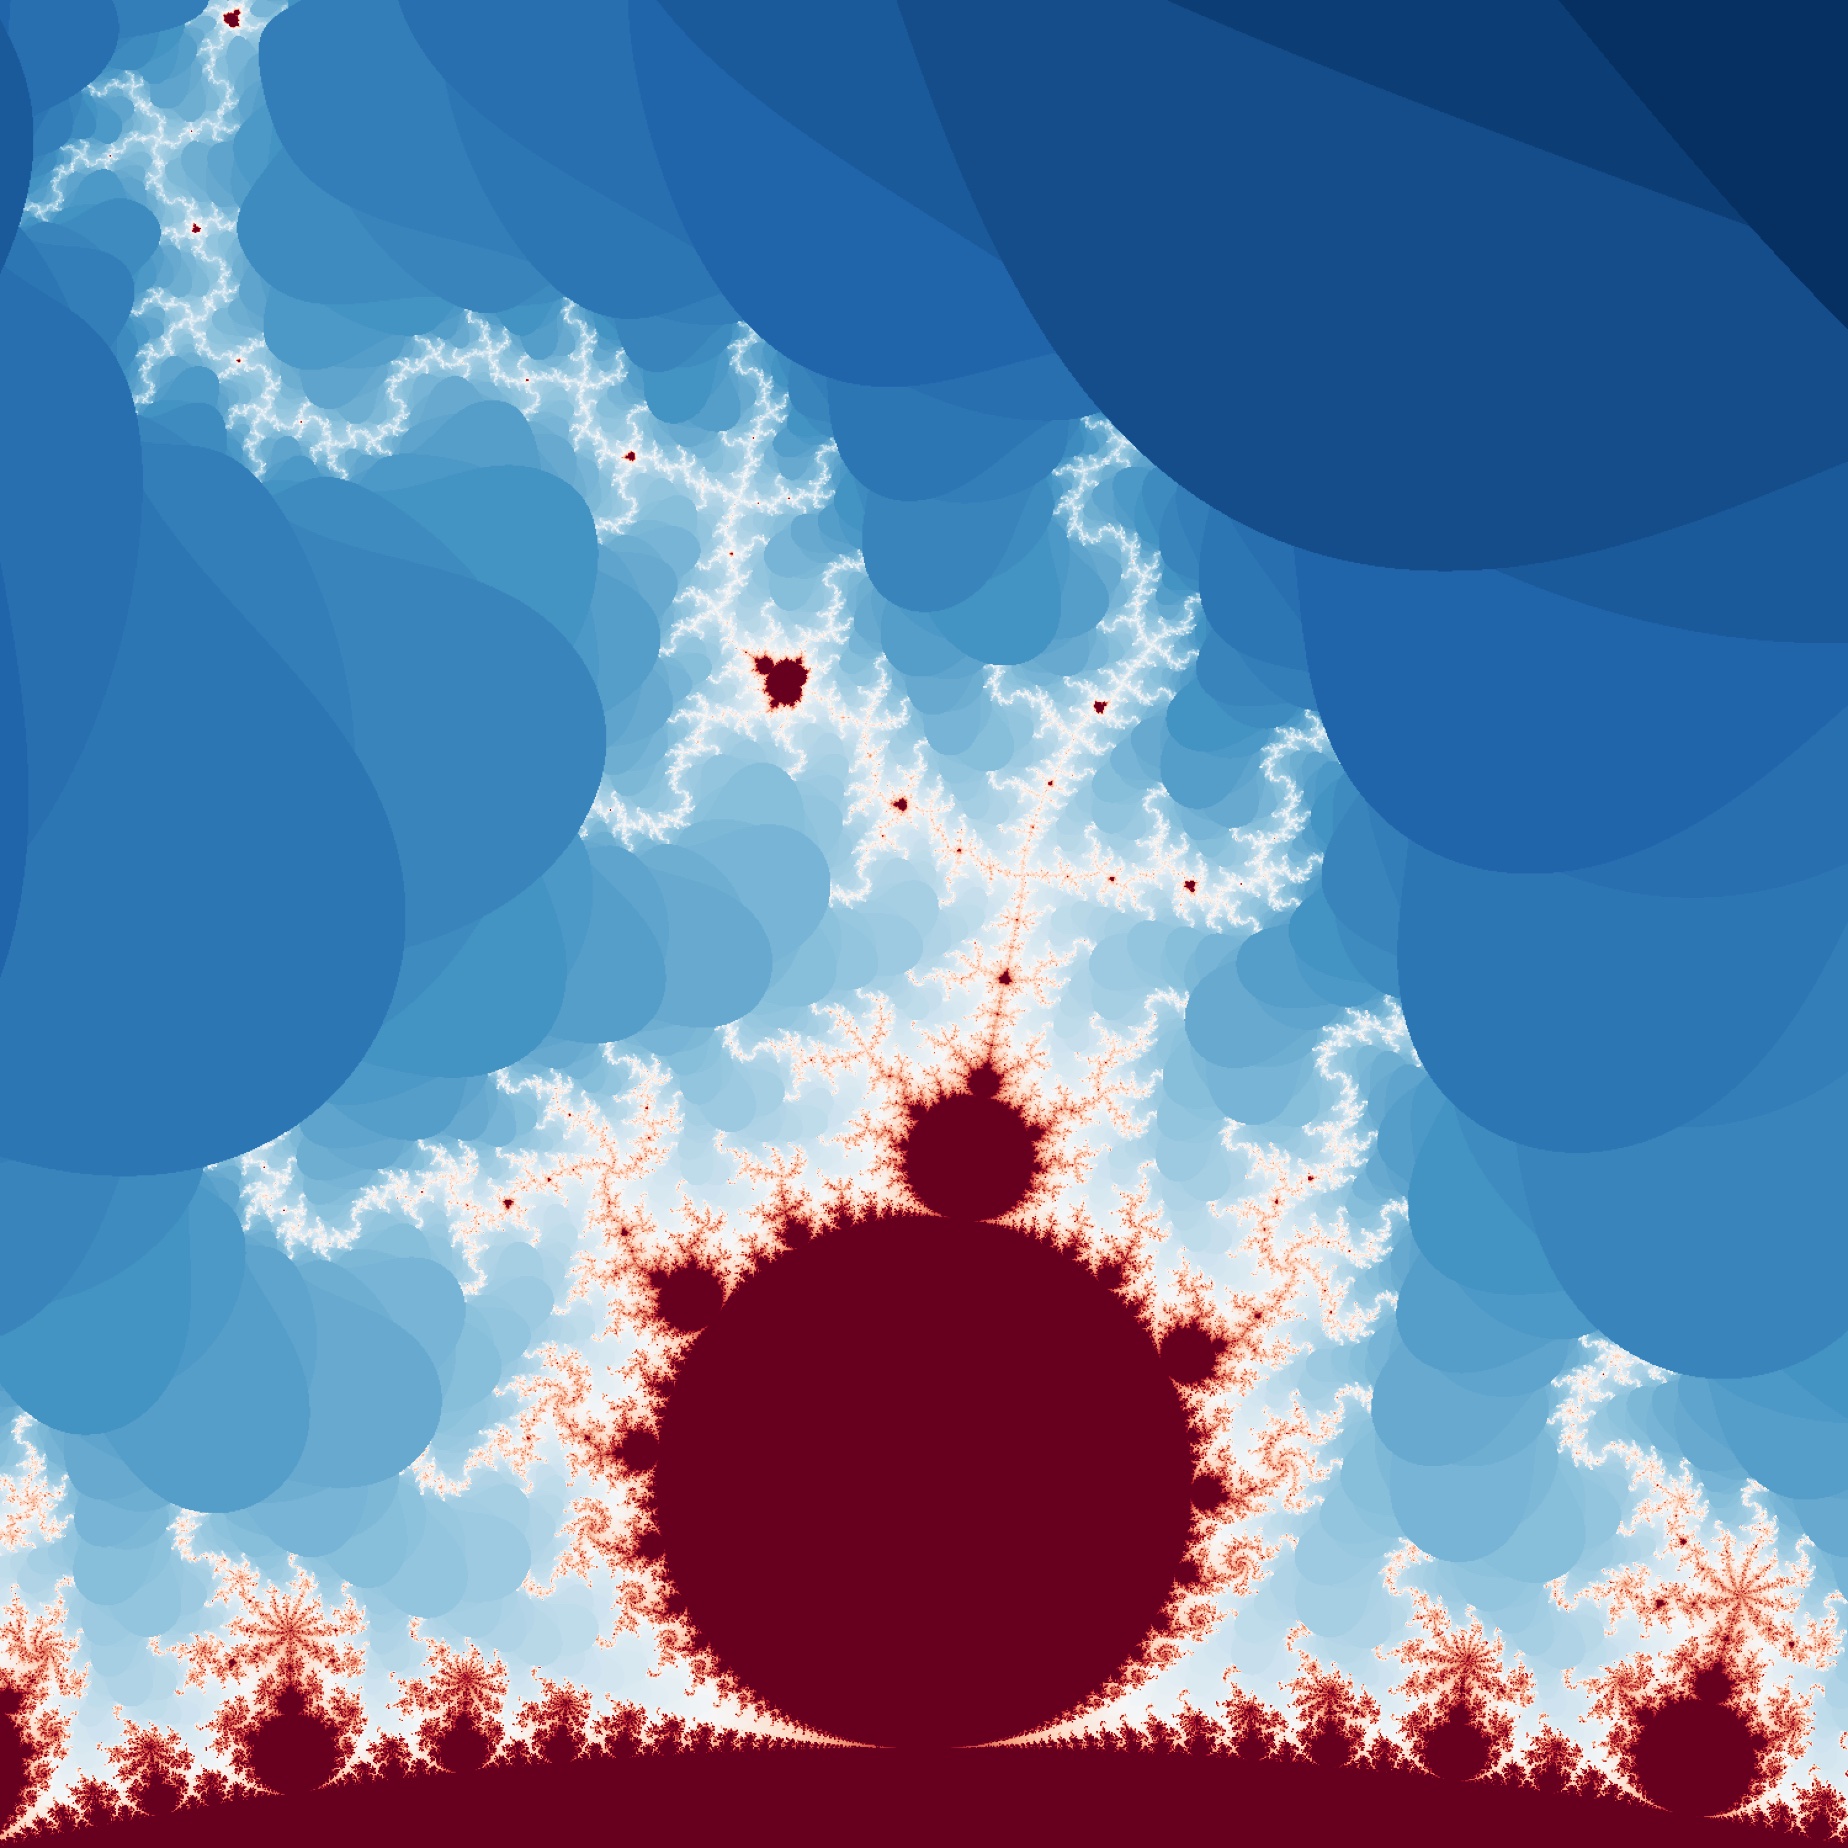
A modified Mandelbrot set
This image uses the quadratic map z_t+1 = (z_t + c)^2.
The blue, pill-shaped effect shows up for this equation when I stop calculating points which move beyond an escape radius of 2.
As I increase the escape radius, things visually look more like the standard Mandelbrot set, although I do not know if they actually converge.
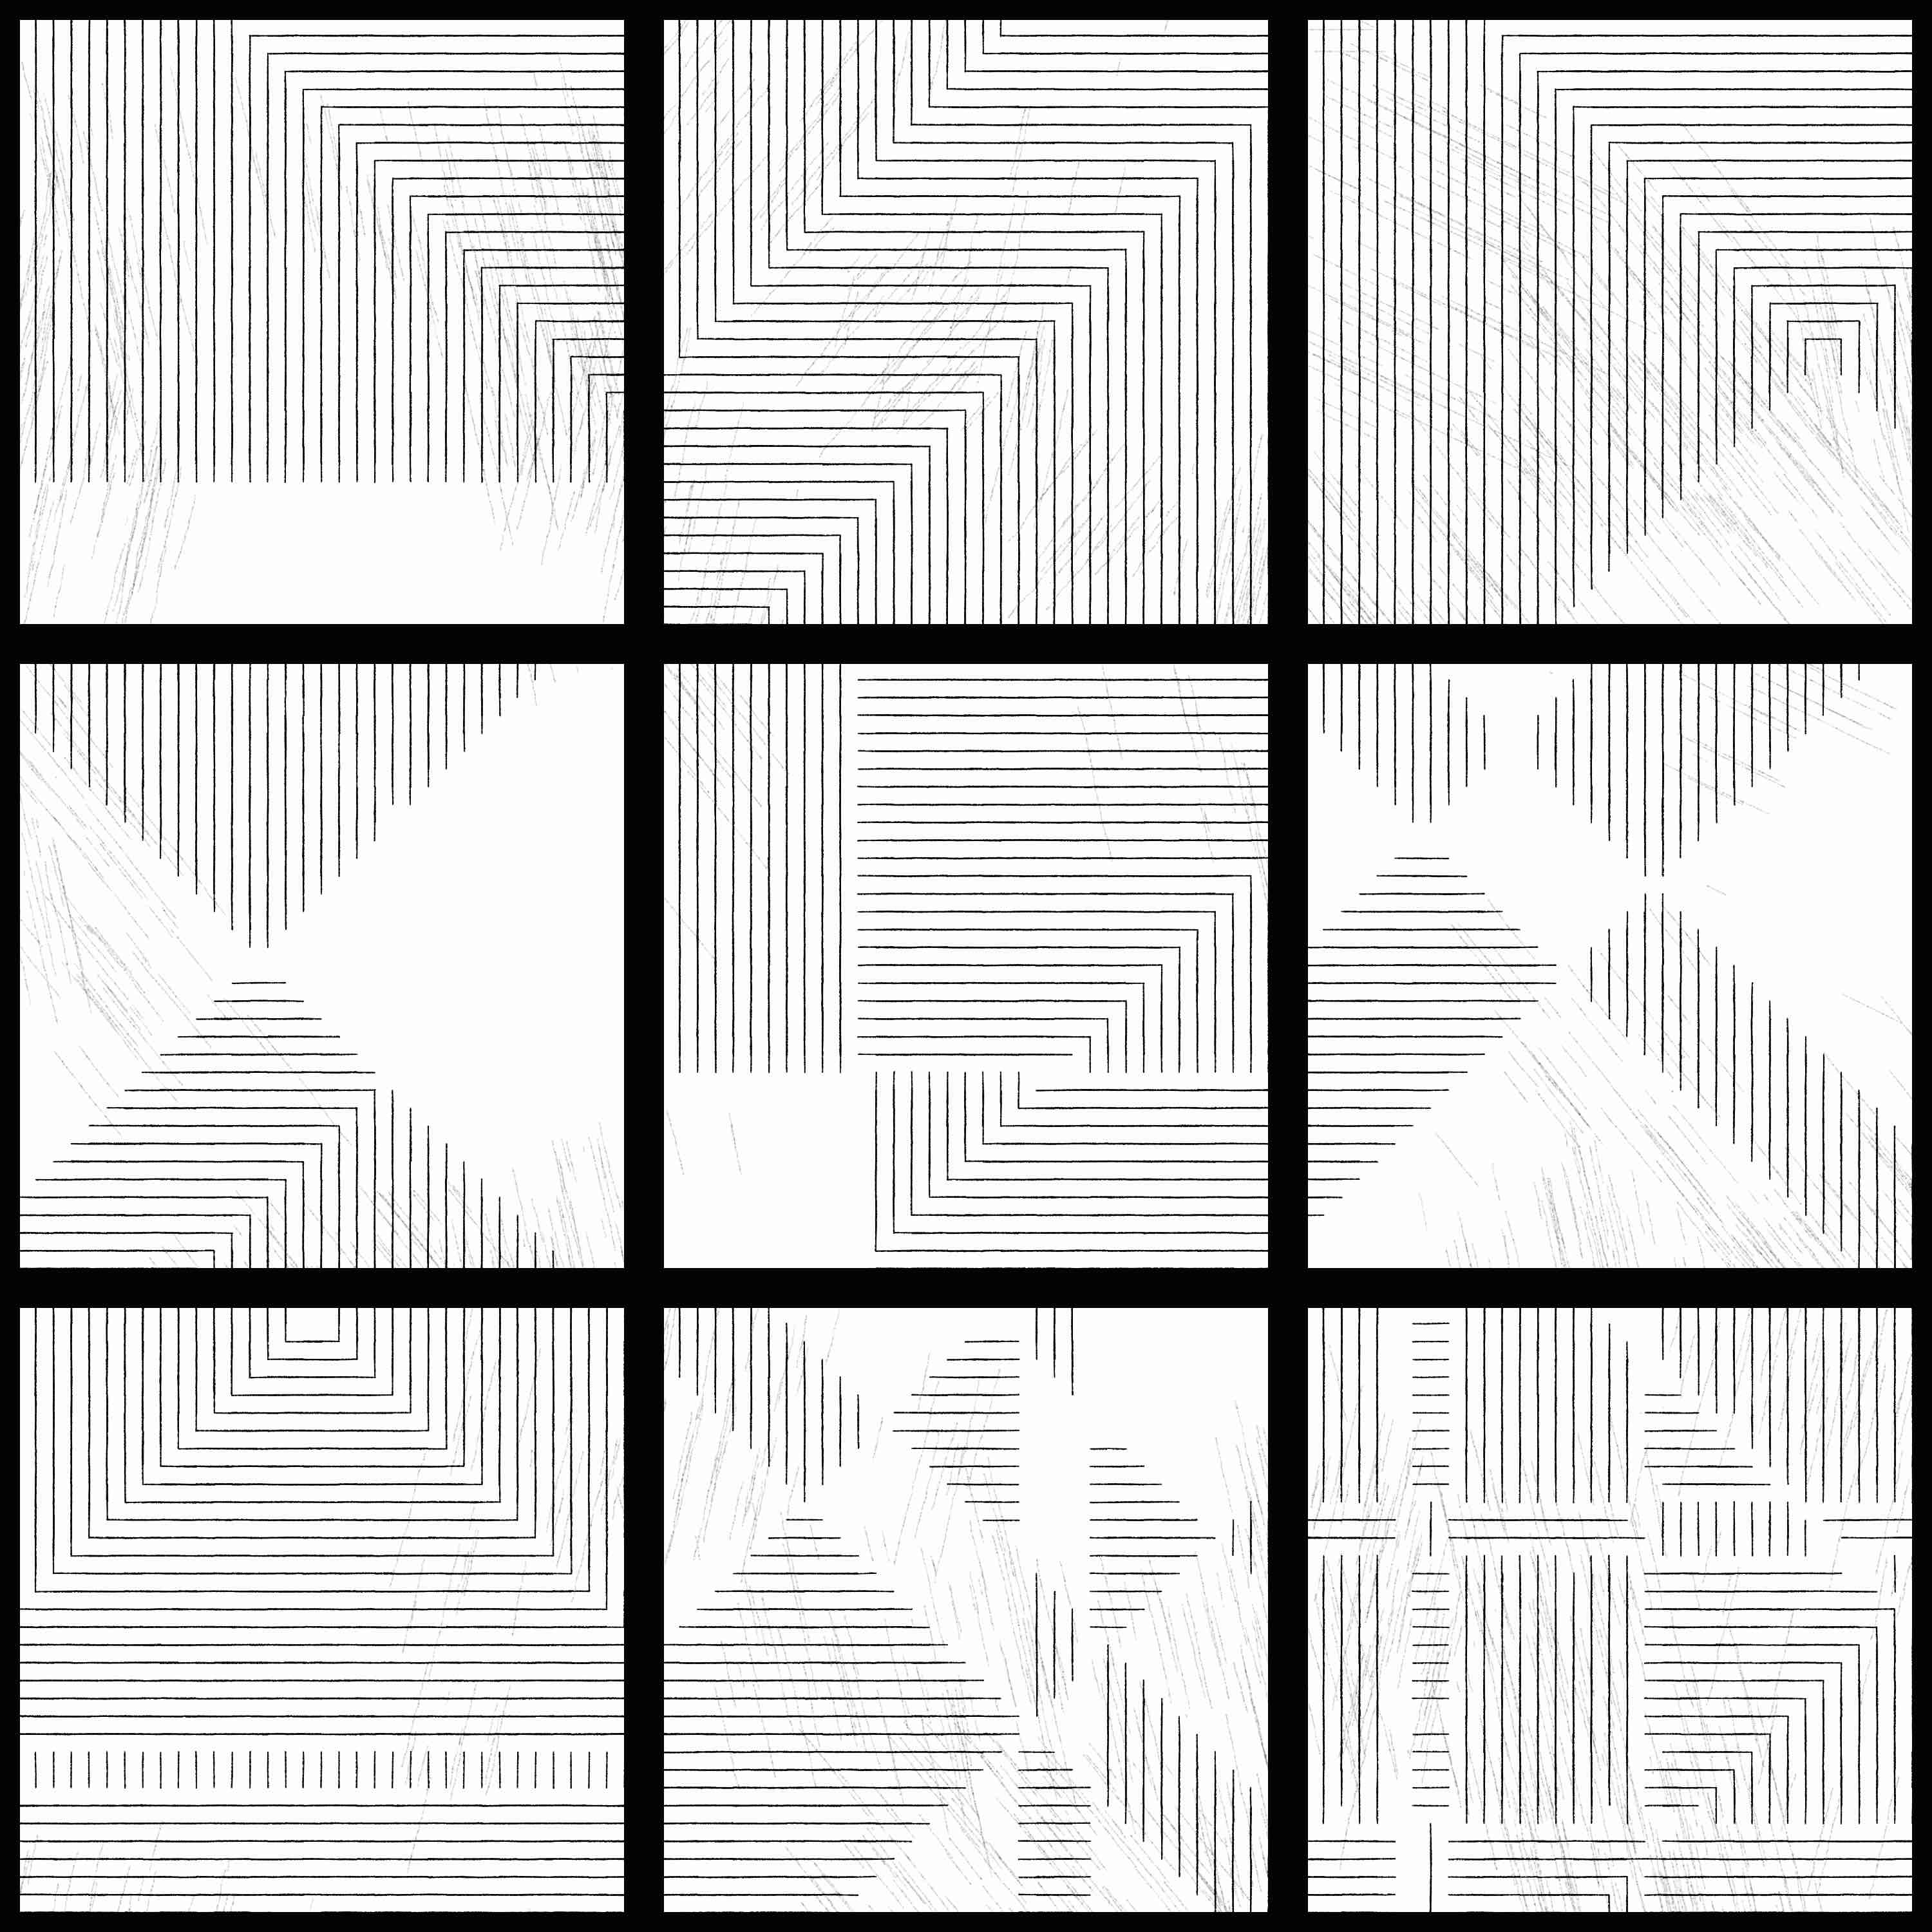
I found some cool
woodblock prints,
"Tecelares", by the Brazilian artist
Lygia Pape
and wanted to generate variations on the theme.
The top left square below corresponds to the original woodblock.
I interpreted the underlying structure as a set of "boundaries" which govern the behavior of the carved lines beneath.
As carved lines cross a boundary they may be rotated by 90° and/or have their display set to on or off (or toggled).
For example the top left original has two boundaries: one horizontal that turns off the line display for the bottom quarter, and a second, diagonal boundary that rotates the lines past it by 90°.
To generate a variation on this theme I set the number of boundaries and let the code randomly place them and randomly set their behavior on the carved lines.
All but the top left original are the result of the code following these rules.
Check out my
p5.js sketch
to try the code yourself.
A composite of generative variations on a theme for one of Lygia Pape's Tecelare woodblock prints.